Exploring Text Outreach for Enhanced Customer Engagement
Elevate customer engagement with text campaigns. Discover the power of personalized text outreach for small businesses, and embrace the future of...
Stay ahead of the competition & maximize your eCommerce business's potential with our guide to calculating and tracking the top customer retention metrics.

Did you know that increasing your customer retention by just 5% has the potential to increase your revenue anywhere from 25% to 95%?
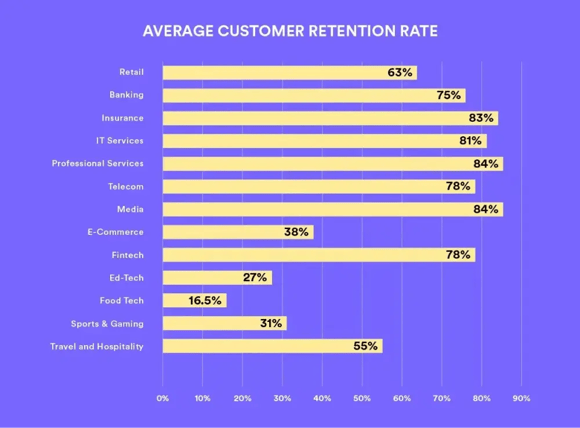
Retention in eCommerce is a problem. The industry average for retention is 38%, meaning there’s plenty of room for growth, but which metrics should we be looking at to target retention?
In this article, we’ll cover six eCommerce retention metrics that you should track to see which aspects of your business are working and which ones are driving customers away.
Customer Lifetime Value (CLV) measures how much revenue an individual customer contributes to your company over time. Sometimes this metric is referred to as CLTV, lifetime value (LTV), or lifetime customer value (LCV).
CLV informs your customer retention decisions, telling you how much you can spend on your retention and loyalty marketing campaigns.
While there are several ways to calculate CLV, it’s really important to note here that Customer Lifespan is really hard to get in a retail environment.
In a subscription world, it’s really easy because a customer turns off their subscription and let’s you know they are done being your customer.
But when’s the last time a customer told you they were done buying from your retail store? They don’t—you have to decide when to consider a customer as “lost.”
You have two options,
Patch allows you to set a # of days in which a customer is considered lost if they don’t return, so that’s what we use when measuring CLTV. The formula looks like this:
Customer Lifetime Value = (Average Order Value * Orders Per Year) * Average Customer Lifespan
Here’s how each part breaks down:
For example, let’s say you own an eCommerce book store, and your customer buys two books a month for a whole year, with the average price per book falling around $20. This is what their CLV would look be for that year:
(2 books * $20 per book) * 12 months = $480
Now, let’s say this customer has been using your book store for the past five years. This puts their CLV at:
(2 books * $20 per book) * 60 months = $2,400
Using this information, you can segment your customers and figure out which ones provide the most value to your business, allowing you to incentivize and retain them.
Your customer retention rate (CRR), measures the percentage of buyers that keep coming back for more.
You run into the same problem with this formula as above, it’s usually applied to businesses that can easily calculate their active customers at the end of the period because they are still subscribing.
When you get into the formula—it just doesn’t make sense unless you can determine which customers are still active at the end of the period.
For example, let’s say you want to know you customer retention rate for 2021—you have a customer purchase a tee shirt in June, are they still active at the end of the period? You have to have some way to determine if they are still an active customer, otherwise they can’t show up in the formula.
So again, make sure you set your conditions for what is considered active and not, then use this formula to determine your retention rate:
Customer Retention Rate = ((# of End Active Customers – # of New Active Customers) / # of Starting Active Customers) * 100
First, you need to determine what timeframe you want to evaluate (week, month, year, etc.). Then, you’ll need to look at each of these factors within that period:
Let’s look at an easy example. A small online bookstore started the first quarter with 100 customers, gained 25 new ones, and ended the quarter with 105 customers. The retention rate will look like this:
((105 – 25) / 100) *100 = 80%
Customer retention rates are an essential benchmark for your business. However, each industry has its own standards for CRRs, so it is best to research them. Here’s a quick look at the average rates for a few industries.

(Source)
This metric is the counterpart to customer retention rates as it measures the percentage of customers you lose over a given period. Unlike retention rates, defection rates do not take into account new customers.
ECommerce stores tend to have higher defection rates and lower retention rates. And while you’ll naturally lose customers to defection, you can lower these rates and significantly increase profits by targeting at-risk customers.
To calculate your customer defection rates, you’ll need the following formula:
Defection Rate = ((# of Starting Active Customers – # of End Active Customers) / # of Starting Active Customers) * 100
For example, the eCommerce bookshop started out the month with 1,000 customers and ended with 975. Here’s what the defection rate was for the month:
((1,000 – 975) / 1,000) * 100 = 2.5%
It’s important to remember that calculating your defection rates does not necessarily help you identify your at-risk customers. To do this, you’ll have to analyze a wide range of metrics. But there’s a simpler way.
Using a retention platform like Patch, you can analyze, target, and recapture your at-risk customers.
The repeat purchase ratio (RPR) measures the percentage of customers who return to your store to make additional purchases. This metric is sometimes called the Loyal Customer Rate.
RPR is a critical metric used to determine your customer loyalty and the success of your retention efforts. Additionally, RPR helps you identify underlying patterns and demographics, helping you tighten up your retention campaigns.
When you calculate RPR, you need this formula:
Repeat Purchase Ratio = (# of Returning Customers / # of Total Customers) * 100
Once again, you’ll need to determine what timeframe you want to evaluate (week, month, year, etc.). Then, you’ll collect this specific data for that period:
Let’s look at an example. For the third quarter of the year, a mid-sized eCommerce bookstore had 6,000 customers make purchases. Of those 6,000, 4,500 were returning customers. So their equation would look like this:
(4,500 /6,000) * 100 = 75%
It should be noted that individual buying behaviors can skew your RPR. You’ll want to make sure you look at purchase frequency for individual customers along with this metric to assess trends.
Purchase frequency measures how often the average shopper makes a purchase from your store. While it is closely related to RPR, purchase frequency looks at all customer interactions over time–not just repeat customers.
When used alongside RPR, this metric is a powerful KPI that helps you track your business growth and revenue. Plus, it gives you insights to purchase behaviors so you can adjust your retention marketing efforts accordingly.
The formula for purchase frequency is very simple:
Purchase Frequency = # of orders / # of unique customers
Like all the metrics on this list so far, you’ll need to determine what timeframe you want to evaluate. Then, you’ll compile the following:
Let’s look back at the example from above. That mid-sized eCommerce bookstore processed 120,000 orders this past year from 22,000 customers. Here’s what their purchase frequency would look like:
120,000 / 22,000 = 5.45
So from this, we know that the average shopper is making between 5-6 purchases per year from this store—which is great!
It’s important to note that the longer the time period you measure, the larger your purchase frequency will be and vice versa. This metric does not work well with shorter time frames since customers haven’t had the opportunity to return for purchases.
Time between purchases measures how long it takes for the average customer to return and make a purchase. To get the most out of this metric, it’s best used with NPS scores and other satisfaction metrics.
This metric is a great indicator of how happy your customers are with their purchases and how likely they are to continue doing business with your brand.
To calculate the time between purchases, you’ll need this formula:
Time Between Purchases = Sum of individual purchase rates / # of repeat customers
This is a multi-step process. Here’s the breakdown of this formula:
To find the sum of the individual purchase rates, you must first find the individual purchase rates for each customer.
Let’s say Customer A buys one new book from their favorite online bookstore this year, and it takes them an average of 14 days between purchases. That makes their individual purchase rate 14 days.
Here’s a chart of other customers’ averages so we can move forward with the calculation.
| Number of Purchases | Average Number of Days Between Purchases | Average Purchase Rate | |
| Customer A | 1 | 14 | 14 |
| Customer B | 1 | 60 | 60 |
| Customer C | 2 | 30 | 15 |
| Customer D | 5 | 180 | 36 |
Now take the sum of their purchase rates and divide it by the number of customers. Like this:
(14 + 60 + 15 + 36) / 4 = 31.25
As you can see, the average purchase rate for this online bookstore is 31 days. Remember, this calculation is not for first-time/new customers as it only looks at how long it takes to buy from you again, and they haven’t…yet.
If you’re like most eCommerce businesses, you probably use a handful of tools to keep track of the metrics we talked about above.
But what if they were all located on one platform? And better yet, what if they were in easy-to-read dashboards that let you segment users and customize your date ranges?
With Patch, you get all this and more. Check out this quick video showcasing their customer retention dashboard:

We use in-depth RFM analytics to provide insights into every aspect of your business.
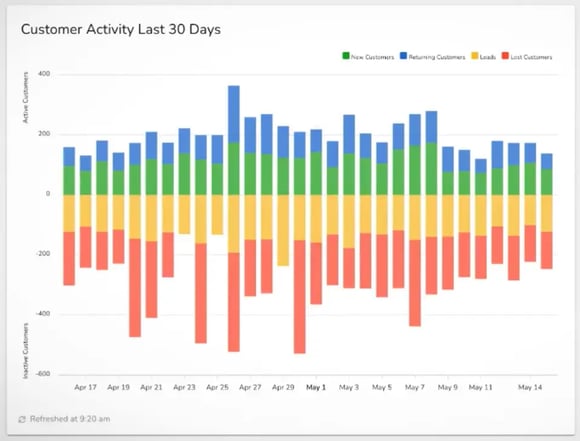
The system automatically collects and analyzes information about your customers, and then segments them into easy-to-use dashboards that allow you to track a wide range of metrics.
Our platform makes it easy to:
Don’t waste another minute checking through X amount of tools. Get the most out of your metrics and up your retention game.
Elevate customer engagement with text campaigns. Discover the power of personalized text outreach for small businesses, and embrace the future of...
Discover the power of automated text campaigns with the best texting software for business communication. Elevate your strategy and engage with...
Simplify age verification in your business with quick and compliant SMS checks using the Message Reply Block.